What is happening in Beauty, Fashion, Electronics, Automotive, Sports, Travel, and Music? And what are these audiences searching for, shopping for, and also watching?
Get the full view here in our latest update of Category Infographics and keep reading for key takeaways from the series.
Consumer Electronics
Electronics videos tend to be lengthy reviews that rack up many minutes watched. Let’s see how these loyal and engaged viewers stacked up in 2022.
- This audience is 72% male. Within this audience, there are more viewers from the 13-17 yr demo than 45-54 yr demo.
- Viewers are 4.5x more likely to shop for Old Spice online than other audiences.
- 3D printing is ripe for more content as it’s the least saturated subcategory with only 26k video mentions with the highest viewership averaging +35k V30 viewers. White space opportunity, anybody?
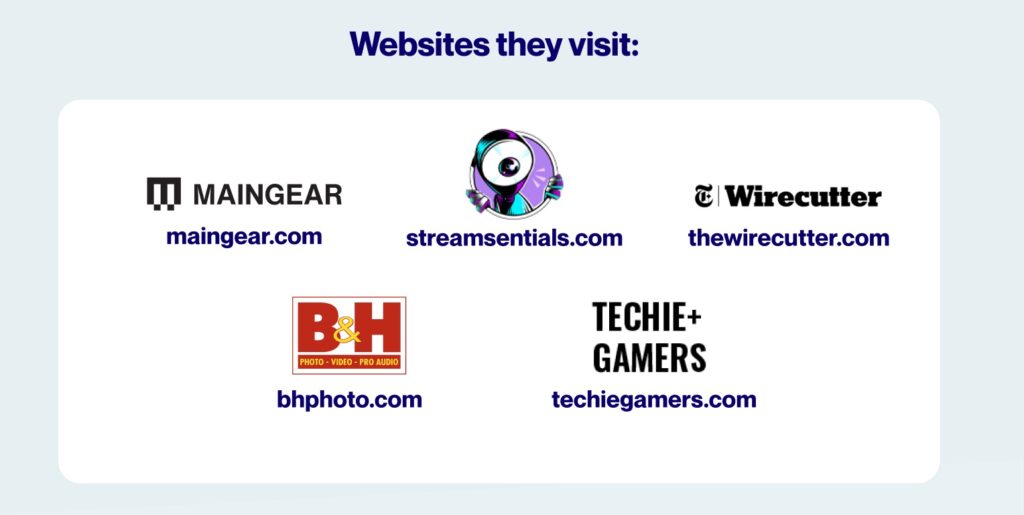
- Electronics content viewers are 17x more likely to visit the website of a high-end custom computer manufacturer, like www.maingear.com.
Fashion
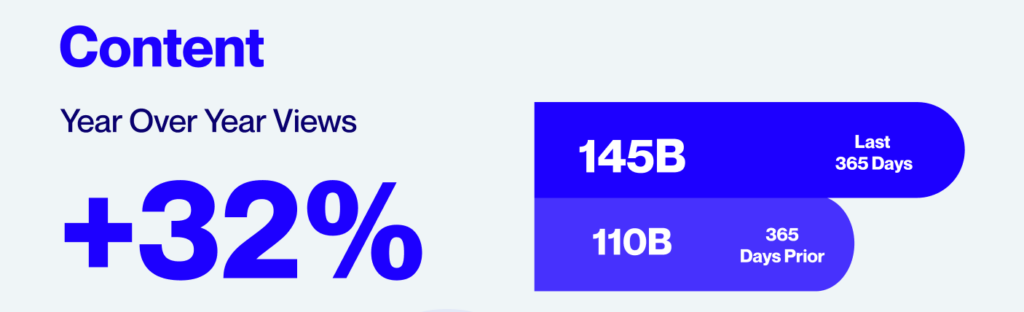
The Fashion category grew 32% year-over-year, let’s take a deeper look at what was happening to drive this growth.
5. Workwear comes out as the subcategory with the highest average V30 viewership of 1.9M with only 29k videos published.
6. Body Positivity is trending! This audience is 4.7x more likely to watch Body Positivity videos than other audiences, which is why Fashion brands should lean into this movement.
7. Fashionistas are a creative bunch, as they are 6.1x more likely to purchase Drawing Books than other audiences.
8. This audience is 4.8x more likely to shop for Polaroid on Amazon than other audiences. Got to document the OOTD!
9. Expect watches to be on trend. No outfit is complete without an iconic accessory – this audience is 14.9x more likely to visit the watch creator’s site, www.millenarywatches.com.
Sports
With the Beijing Olympics and World Cup in one year, we weren’t surprised to see a 33% YoY growth in the Sports category reaching 347B views!
10. Some would be surprised to know that the subcategory with the highest V30 viewership also had the lowest quantity of content produced. Lumberjack Sports peaked viewership with an average of 1.1M V30 views per video.
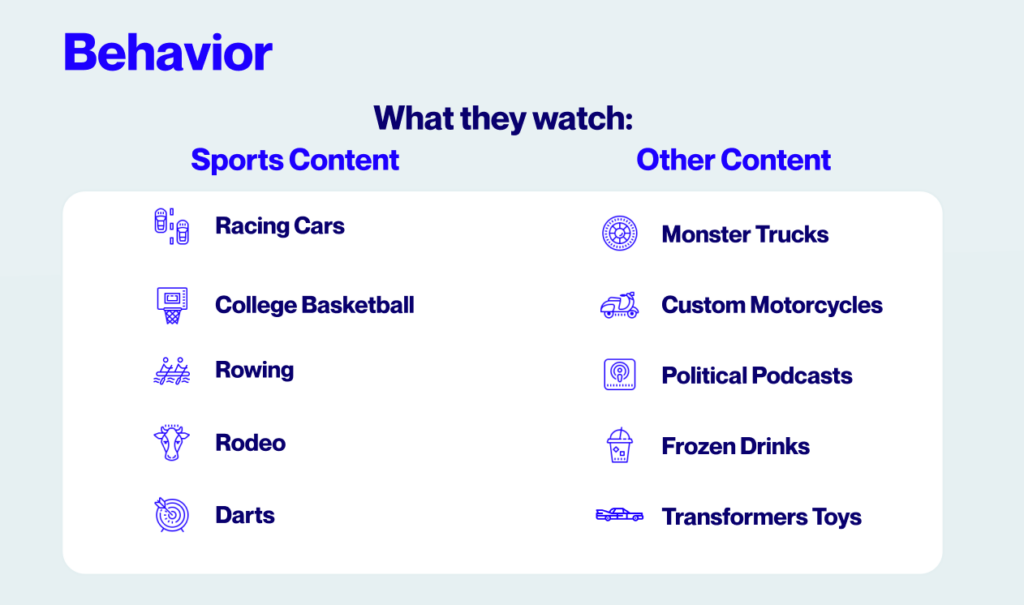
11. Sports fans love good competition. No surprise they are 3.8x more likely to watch Race Car videos than other audiences.
12. Video podcasts are on the rise, and our social video analytics indicate Sports fans are 3.2x more likely to watch Political Podcasts.
13. Keto-friendly food brand, Quest, has climbed in popularity this year and Sports fans have a particular affinity for them. This audience is 3.9x more likely to shop for this brand online than other audiences.
14. Sports social video analytics indicate a shared interest in automotive content. No surprise these viewers are 15.4x more likely to visit the BMW website at www.bmw-motorad.com.
Automotive
Looking into the data for the Automotive audience tells us a lot about who these viewers are and what they are interested in. As cars drive full speed into futuristic technology and design, we continue to see a high overlap in interests between the automotive category and technology.
15. The +55yr demographic racks up more viewership than the 45-54yr demo which is uncharacteristic for most social video category demographic charts.
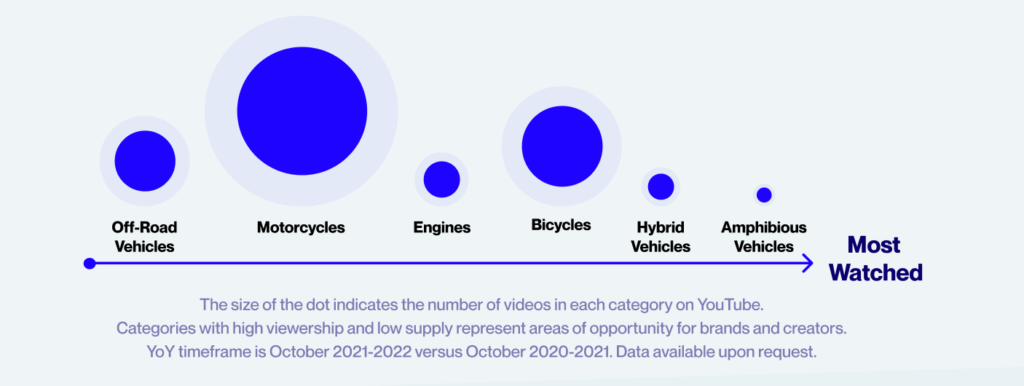
16. Videos about Amphibious Vehicles average the most V30 views per video at +360k in this category within the last year.
17. Automotive viewers crave the novelty and the exotic. They are 4.1x more likely to watch content about Retro Cars and Monster Trucks, and 3.6x more likely to watch content about Hybrid Vehicles.
18. This audience is 3.9x more likely to also watch content about Ireland Travel… perhaps all those car commercials are inspiring long drives through the lush Irish countryside?
19. This audience likely spends time in cold climates as they are 8x more likely to buy Snow Boots and 6.1x more likely to buy Snow Removal Tools
Travel
With 2022’s travel boom, travel content grew 29% YoY reaching 97.2B views. Let’s take a closer look to understand what these wanderlust viewers are interested in.
20. Beaches are the subcategory with the most videos, 17k in fact, but Caribbean Travel presents a white space opportunity with only a few thousand videos in 2022 averaging the highest V30 viewership in this category at 545k per video.
21. Travel viewers don’t just explore new places, they also explore different beliefs. This audience is 4.2x more likely to watch videos about Mythology.
22. Travel viewers do their research before investing in luggage, they are 3.7x more likely to watch content about Luggage.
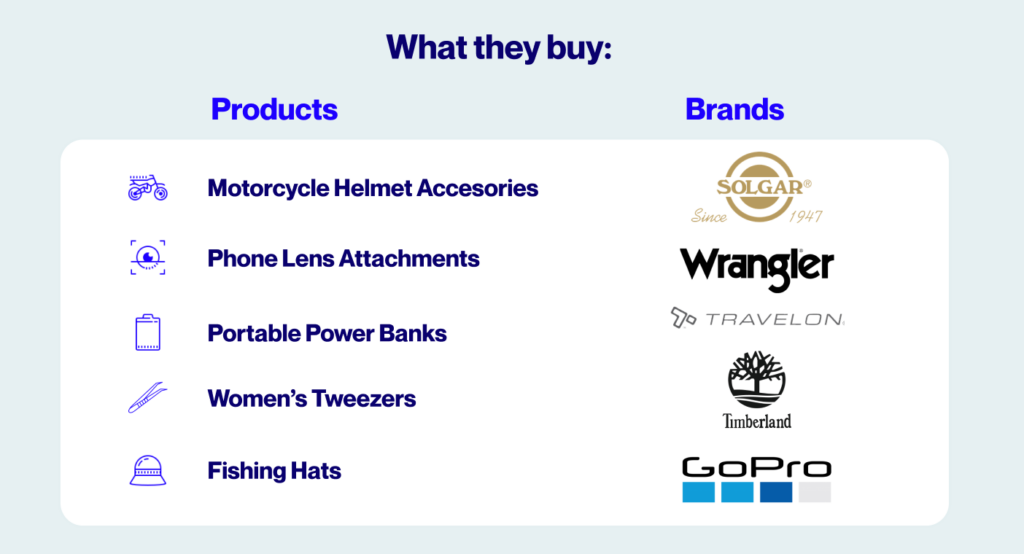
23. Part of wanderlust is documenting your travels! This audience is 5.9x more likely to shop for iPhone Lens Attachments.
24. Being off the grid is a part of the journey; this audience is 5.1x more likely to shop for Portable Power Banks.
Music
The massive Music video category reached 1.7T views in 2022. Looking into the viewership trends and behaviors, we can see what types of songs, creators, and related content drove this category. Who are Music lovers today and what do they care about? Get the quick stats below to find out.
25. Males 18-34yrs make up nearly half of all Music views while females of the same ages make up only 25%.
26. The most significant white space subcategory that has low saturation and extremely high viewership is Novelty Songs. This subcategory averages 740k V30 views per video.
27. Music viewers are culturally curious! This audience is 2.5x more likely to watch Masala Films and videos about Danish & Swedish Cuisine and 2.2x more likely to watch German Travel videos.
28. Music lovers do their research on products and technology they’re interested in. They are 2.2x more likely to watch videos about Audio Engineering and Audio Players.
29. Music audiences have a strong overlap with beauty and skincare audiences, they are 2.6x more likely to shop for Makeup Removers and 2.1x more likely to shop for CeraVe online.
To dive even deeper and unlock the visual breakdown of our Category Infographics, click here.
You’ll see an extensive list of top product categories, brands, and websites these category audiences are interested in.
Any of the category insights you see can be pulled and applied to your specific audience, brand, or industry. If you’re ready to get closer to your audience, request a free demo today.