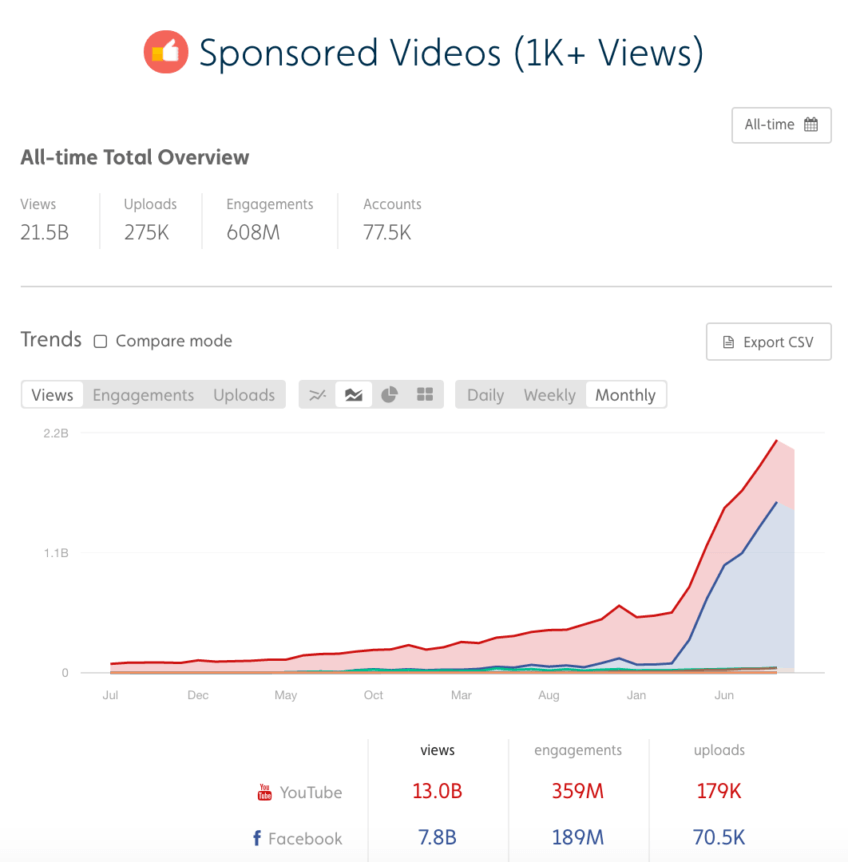
It’s no surprise, sponsored video content is on the rise. Viewers love it because content appears organic and is more informative and engaging, and publishers love it because it represents a viable monetization path. Clearly, there is a vast opportunity for brands and content publishers to partner together to create strategic and valuable partnerships. However, a question a lot of content publishers and media companies are faced with is – “where do I start?” and “how do I convey the value of my network to brands?”. Tubular can be leveraged as a video intelligence tool to find brands who are investing in sponsored content and also pitch sponsored content partnerships to brands. In this post, we will teach you how to create a data-driven content and distribution strategy to pitch to brands. First things first, let’s look at the Tubular Track Dashboard to see how sponsored video is performing on the whole. As we can see, over 275K videos have been uploaded all time, with over 21.5 billion views and 608M engagements – WOAH – it also looks like things really started to heat up in January 2016, with many publishers jumping on the branded content wagon.
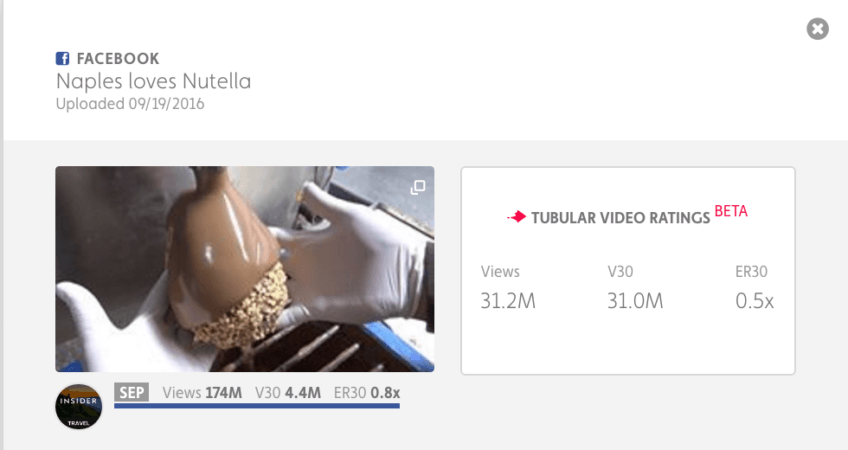
Now let’s look at the top performing branded content video in the last month. The Facebook video, “Naples loves Nutella” – published by Insider Travel, garnered the most views with a V30 (first 30-day video views) of 31 million and ER30 (first 30-day video engagement) that is 0.5x more engaging than the average video. This delicious clip features the Italian food mecca Naples, and the various applications of the famous hazelnut-chocolate spread Nutella.
So how do you achieve a match made in Nutella heaven? In today’s blog post, we’ll explore how to leverage Tubular to prove the value of your content and audience to create stellar pitches for brands and advertisers. In this blog post, you’ll learn how to:
- Find Your Story
- Prospect & Pitch
- Target & Measure
Step One: Find Your Secret Sauce…
So, let’s kick things off. First, and foremost, it’s important that you find your unique story and differentiator and determine what you’re number one in – you can be number one in many different metrics or elements, some of which we’ve outlined below:
- Views
- Engagement
- Category or Topic Rank
- Campaign Performance
- Audience Demographic Match
- Audience Affinity Match
It’s important to have this data point to effectively pitch yourself out to brands. Now, let’s review some interesting ways Tubular customers are already doing this…
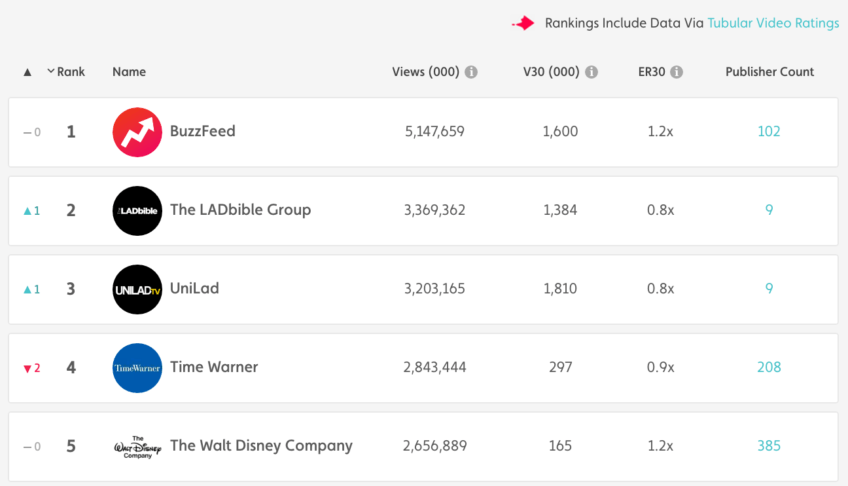
Here, by looking at Tubular Rankings from August, we can see that The LADbible Group ranked second across global media properties – trumping their competitor UniLad in overall August views. Similarly, BuzzFeed can also highlight that it has 53% more views than The LADbible Group.
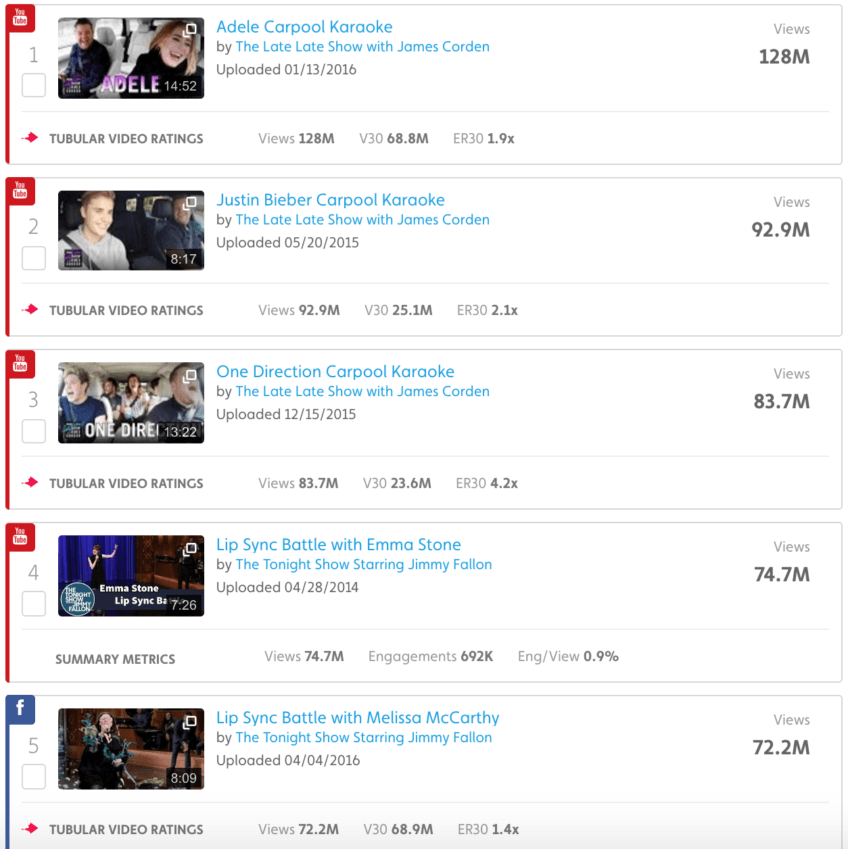
A recent example of highlighting best performance in a category was when Variety featured an article on James Corden’s top position in the late-night video category. Using Tubular data, CBS Interactive was able to highlight the success of James Corden’s Carpool Karaoke in a press release. The story was picked up by more than 30 publications including USA Today and Billboard. Tubular data continues to be used to verify Carpool Karaoke’s place as a top viral hit. Clearly, we can see from the example below that The Late Late Show with James Corden, occupies the top three position with video 4 and 5 belonging to NBC’s The Tonight Show Starring Jimmy Fallon.
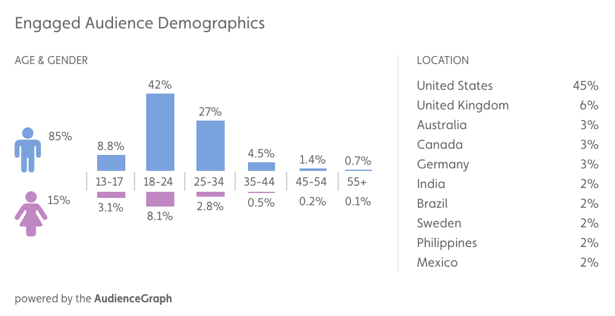
Using Tubular, we can also identify audience demographic match and brand affinity. In this example below, we can see that Team Coco’s audience demographics skew heavily male, with 85% of its content popular and ripe for pitching to brands that are popular amongst male audiences. You can view audience demographic data in Creator Intelligence, by delving into a specific creator’s channel.
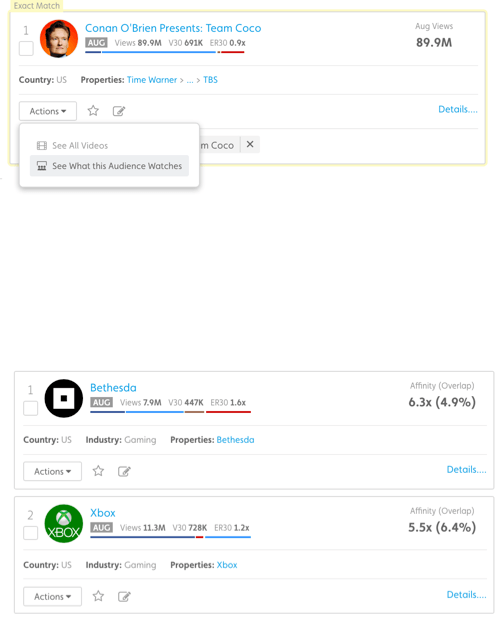
In addition to being popular with a male demographic, Team Coco also boasts high affinity amongst gaming franchises Bethesda and Xbox. In this Creator Intelligence example, we can see that Conan’s audience is 6.3x more likely to engage with Bethesda, sharing 4.9% in audience overlap.
As you can see from the above examples, using these dimensions, there are multiple ways to prove you are number one. At this point, it is important to note that it is difficult to be number one in everything, so be mindful of this when pitching to brands, make sure you are promising them the right metrics, i.e., views, engagement, audience overlap, etc.
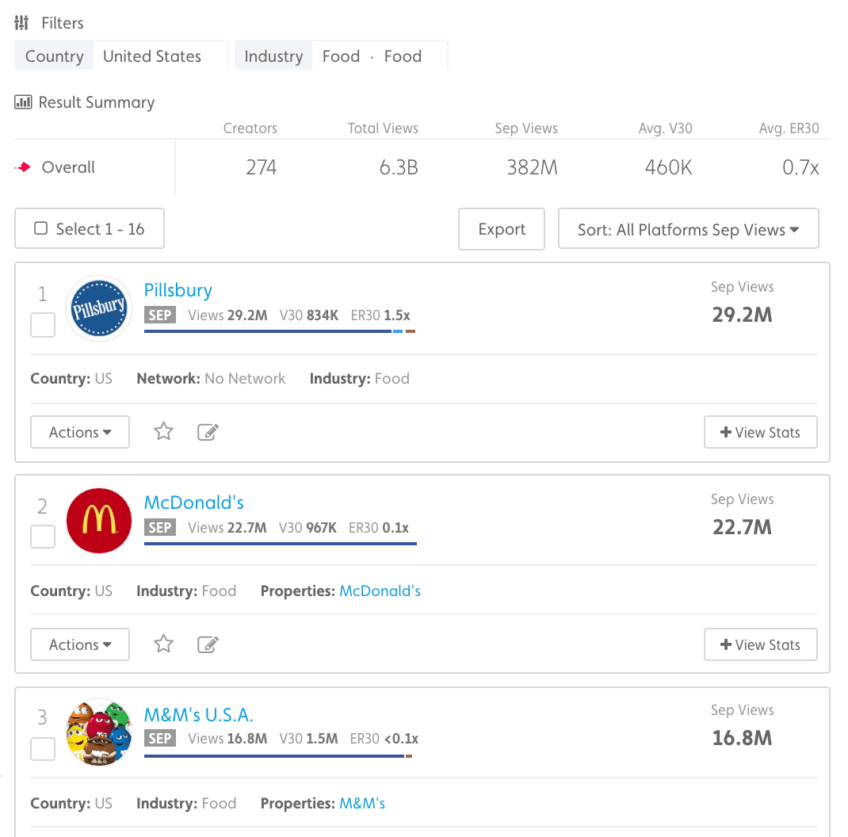
Another way you can highlight your soapbox status is by showing your performance in a specific category. Whilst Pillsbury may not hold the top spot for brand channels based in the United States, they do hold the top-spot for the food category. Using Creator Intelligence, and the Topic and Country filters, we can view best-performing food brands in the United States – which for September appears to be America’s baking-goods favorite, Pillsbury – with over 29.2 million views.
Step Two: Prospect & Pitch…
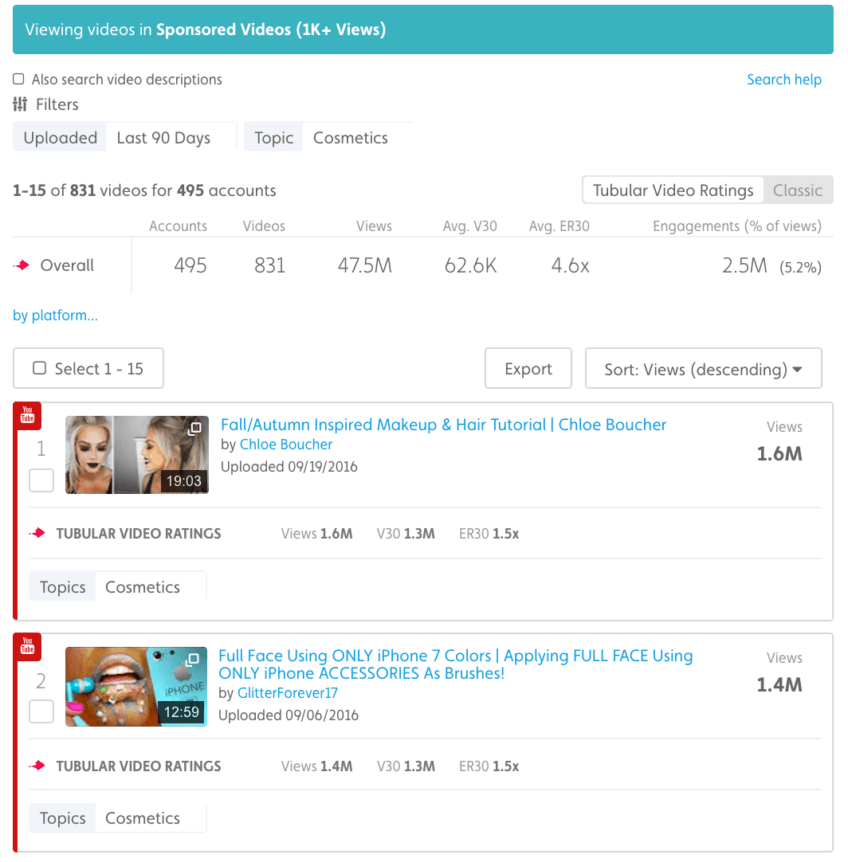
So after you’ve found your story, the next step is to prospect and pitch to the brands you are targeting. Looking at the “Sponsored Videos” Saved Search in Track Dashboard, you can glean insights into the brands that are investing in sponsored video. For example, searching for a beauty brand for a sponsored, influencer collaboration? With the click-of-a-button, you can view all sponsored videos in Video Intelligence and sort by “Cosmetics” in the Topics filter to see which beauty brands have made recent investments in sponsored video. Looking at the first video featuring beauty influencer, Chloe Boucher we learn that she has featured make-up brands Giorgio Armani and NARS in her make-up tutorial.
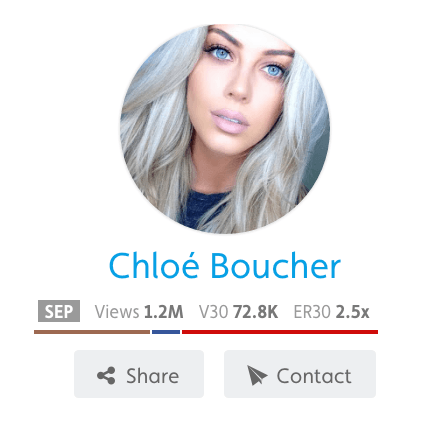
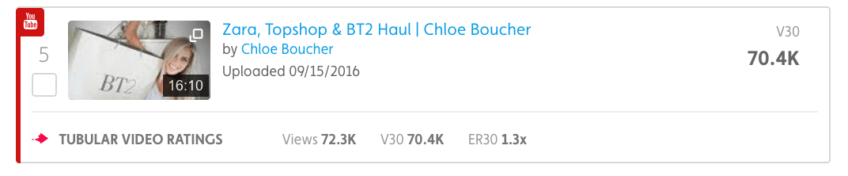
Here, V30 (first 30-day video views) can also be used as a powerful metric to predict organic view growth. In this example below, we can see that Chloe Boucher’s shopping haul video on Zara, Topshop and BT2 has over 72.3K views with a V30 of 70.4K, her content also boasts strong engagement, with 1.3x ER30. Looking at Chloe Boucher’s performance at the creator level, we can see that her channel earned 1.2 million views in the month of September and a V30 of 72.8K – which is very similar to the V30 at the video level.
Step Three: Target & Measure…
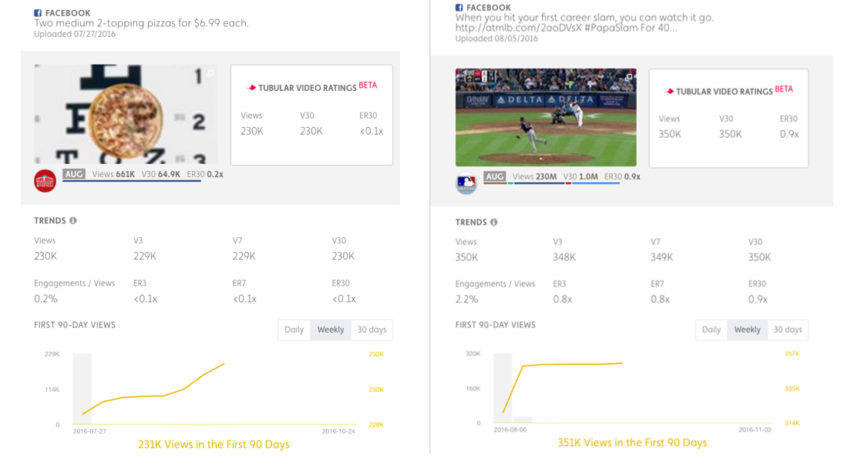
The final piece of the puzzle, after a campaign has run and the collaboration is said and done you should be measuring performance. As a publisher, how do you ensure that you are delivering results to brands and as a brand how do you ensure that you are getting a solid return on your investment? Most recently, major sports teams have expanded their sponsorship opportunities via Facebook. In this example below, we can see a recent video from Papa John’s and Major Leauge Baseball (MLB). On every Facebook video that MLB posts of a home run, they have a “handshake” collaboration with Papa John’s. Here, MLB can clearly highlight to Papa John’s the power of their sponsored campaign in comparison to native content promoted on the Papa John’s channel, with 52% more views and content that is 9x more engaging.
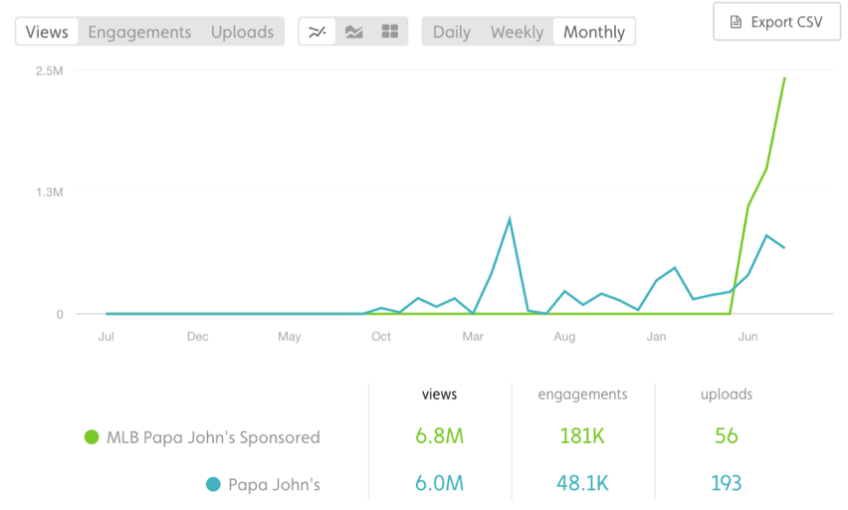
Using a Tubular “Saved Search” in Video Intelligence, we can also send these videos to the Track Dashboard for a side-by-side comparison. Clearly, the sponsored MLB Papa John’s collaboration is much more engaging than native Papa John’s video content. In this view below, we can see that MLB Papa John’s sponsored campaign which began in June, has already outperformed ALL Papa John’s video content.
So there you have it! We hope these tips will help you source Tubular data to better inform your sales pitches to advertisers. Remember, we’re always here to help customers achieve their online video missions.